Phase 1: Objectives, Methods, and Results
Objectives
Assess adherence to mitigation and prevention guidance, social and economic impact of mitigation and prevention measures, and establish a pool of participants for selection into subsequent cohort study (Phase 2).
Methods
Recruitment
Study participants were recruited via a combination of broad and targeted recruitment methods. The goal was to obtain a study samples that was representative of Pitt county. Recruitment was conducted via email, listservs, fliers, website/Facebook pages and local media. Below are some outlets used in the ComPACT recruitment process:
- AMEXCAN
- Chamber of Commerce; Young professionals network
- Daily Reflector (local paper)
- ECU Graduate Med Students
- ECU Physicians/Pediatrics offices
- ECU faculty and staff (randomly selected; email)
- Greenville EMS/Fire/Police
- Pitt Community College (listserv email)
- Pitt County HD webpage and testing sites
- Pitt County Schools
- Pitt County Vol. EMS
- Pitt Partners for Health
- Public Radio East
- West Greenville Health Council
- WCTI/WITN local news stations
Eligibility – Criteria listed below.
- ≥ 18 years of age
- Reside in Pitt County since March 1, 2020
- Reside in one of the 14 Pitt County zip codes
- Speak English or Spanish
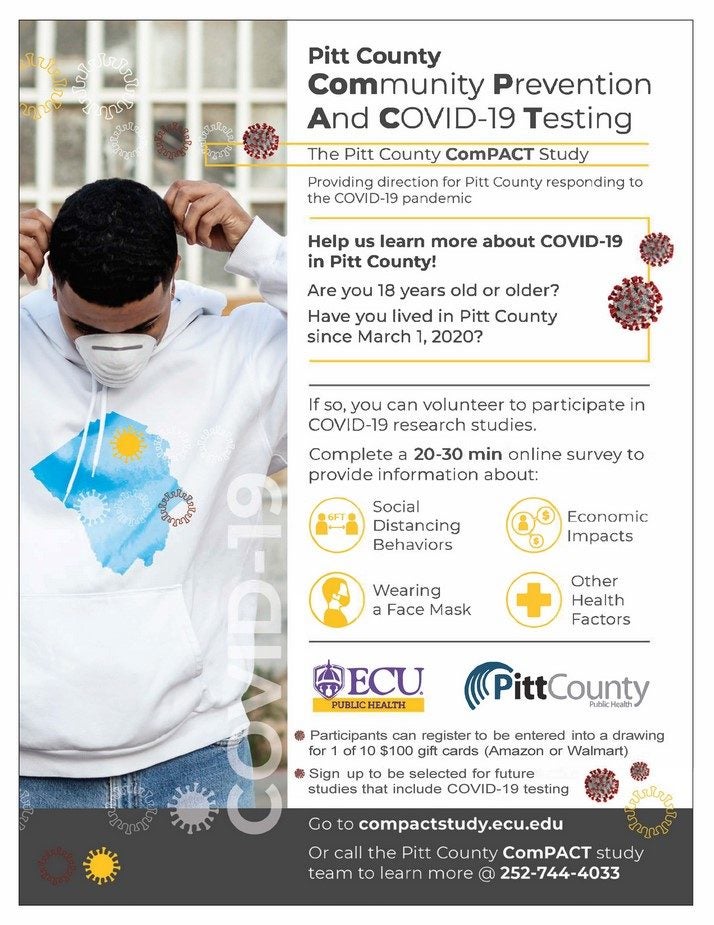 Flyer used in ComPACT recruitment
Data Collection
Phase 1 involved a one-time anonymous survey. The following data were collected:
- Demographics
- Employment, food security, and income/finances (before and after March 1, 2020)
- Current physical health, anxiety, depression, and COVID-19 risk perceptions
- Work-related and personal COVID-19 prevention (after March 1, 2020)
While the survey was anonymous, people were given the option to provide contact information if they were interested in participating in a follow-up phase of the study (Phase 2).
Results
A total of 899 individuals responded to the Phase 1 survey between July 1, 2020 and December 31, 2020. Of these, 335 (37.3%) provided contact information to allow for recruitment into the Phase 2 cohort study.
The results below show how the Phase 1 participant characteristics compare to the Pitt county population. They are further divided into those who could be contacted for follow-up in Phase 2 and those who did not. Of particular interest is how those were interested on participating in the follow-up phase of the study differed from those who did not want to participate in the follow-up phase
Sex and Age Distributions
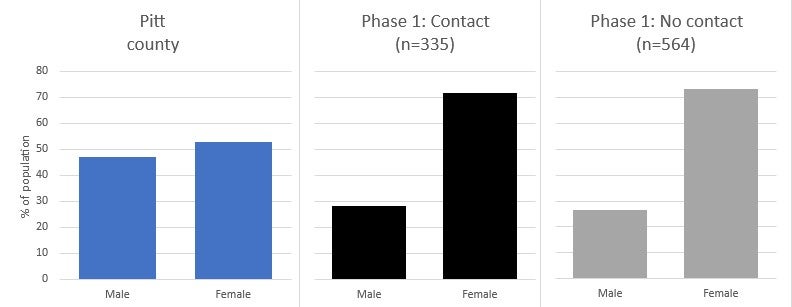
Figure 1. This graph show the distribution of sex for phase 1 of the ComPACT Study compared to Pitt county, by provision of contact information for further study follow-up.
The Pitt County data distribution (on the left) was based on existing census data. Phase 1: Contact (middle) and Phase 1: No contact (right), differentiate the participants that provided contact information for phase 2 of the study and those who did not, respectively. Here, we can see that Pitt county has a fairly balanced distribution of male and female residents, while the ComPACT study participants reflect a much higher percentage of female participants vs male participants, with no difference according to whether participants wanted to be contacted for follow-up or not.
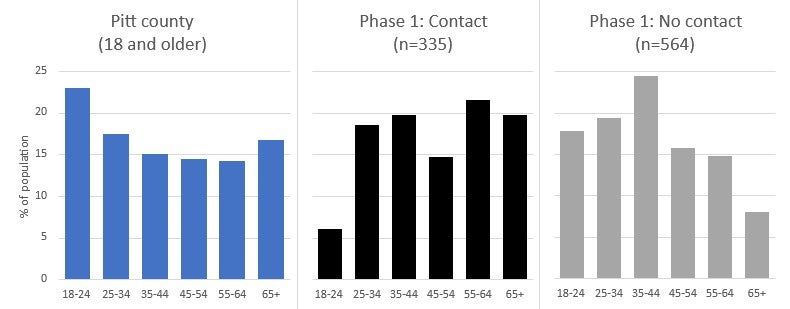
Figure 2. This graph show the distribution of age for phase 1 of the ComPACT Study compared to Pitt county, by provision of contact information for further study follow-up.
Here, we can see that data distribution for participants who provided contact information tends to lean toward participants older in age. Compared to Pitt county data, those in age group 18-24 were under represented in the Phase 1 contact group. Participants who did not provide contact information were younger participants. In contrast, participants who did not want to be contacted for any follow-up tended to be younger than those who were interested in follow-up.
Race/Ethnicity Distribution
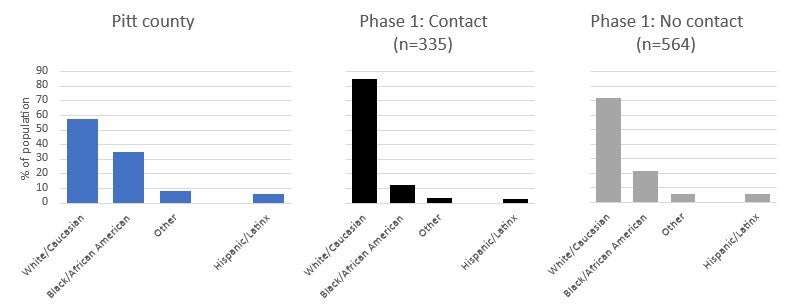
Figure 3. This graph show the distribution of race/ethnicity by provision of contact information for phase 1 of the ComPACT Study.
Pitt county is approximately 55% White/Caucasian, with the remaining population ben predominantly Black/African American. Additionally, less than 10% of the population is Hispanic or Latino/a. In contrast, Phase 1 study participants were predominantly White/Caucasian, with underrepresentation of minority races and ethnicities. This is especially true for those who were interested in being contacted for study follow-up.
Education Distribution

Figure 4. This graph show the distribution of education by provision of contact information for phase 1 of the ComPACT Study.
In these education distribution graphs, phase 1 contact and no contact lean towards a more highly educated group of individuals. Pitt county seems to be more evenly distributed, however, most seems to fall within high school, some college, and college.
Prevention Behavior Distributions
The next set of graphs compare prevention behaviors between those who were interested in being contacted for further study follow-up and those who were not. One hypothesis is that people who were interested in participating in the follow-up study were more health conscious or more concerned about the pandemic, compared to those who were not interested in further participation.
Mask Wearing in Public Hand Hygiene – Washed/Sanitized
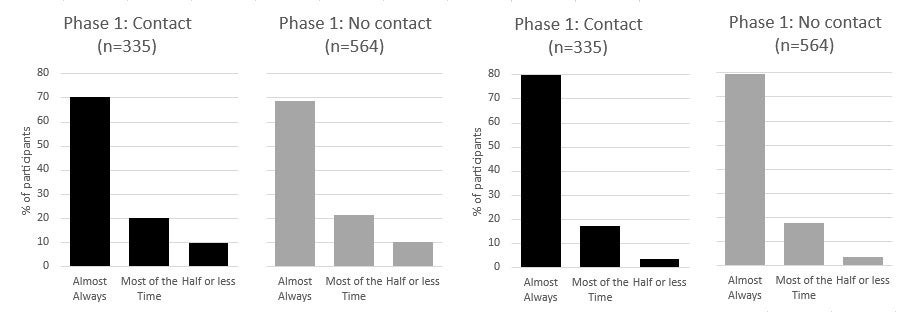
Figure 5. Frequency distribution for how often participants wore a face mask in public, by provision of contact information for further study follow-up
Figure 6. Frequency distribution for how often participants washed/sanitized their hands, by provision of contact information for further study follow-up
Maintained 6 feet apart Avoided Large Gatherings
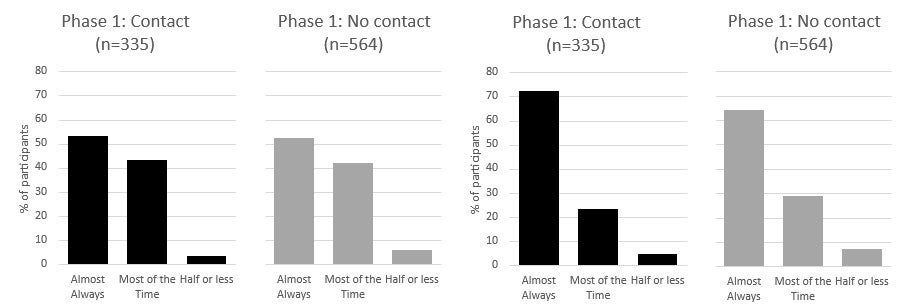
Figure 7. Frequency distribution for how often participants maintained 6 feet apart, by provision of contact information for further study follow-up
Figure 8. Frequency distribution for how often participants avoided large gatherings, by provision of contact information for further study follow-up
Here, we can see four different graphs each looking at a different prevention behavior. We can see similar trends in masking, hand hygiene, and social distancing as most participants tend to report ‘ almost always’ engaging in each for both the contact and no contact groups. Avoiding large gatherings shows a decreased percentage of participants reporting ‘almost always’ engaging in this mitigating behavior and increased percent of participants who report engaging ‘most of the time’. Overall, there were minimal differences between the contact and no contact groups.
Vaccination Distribution
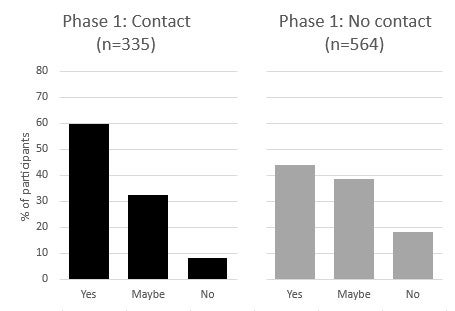
Figure 9. This graphs shows the distribution of participants that planned to
get the COVID-19 vaccine when it became available
In this graph, participants who were interested in being contacted about study follow-up report being more willing to get vaccinated than those who did not provide contact information. Given the nature of the study, a COVID-19 community prevalence study, those who provided information might have already been more inclined to get vaccinated.